Get Full Government Meeting Transcripts, Videos, & Alerts Forever!
Get email alerts on the Assessment Results topic
No spam. Unsubscribe anytime.
Nyssa SD 26 presents MAP results: above‑average growth in many grades, achievement gaps remain
Summary
District presenters told the board winter NWEA MAP data show faster-than-average growth in several grade bands — particularly elementary — though absolute achievement remains below target in some grades; presenters tied MAP trends to SBAC historical ranges (about 30–35%) and recommended targeted interventions.
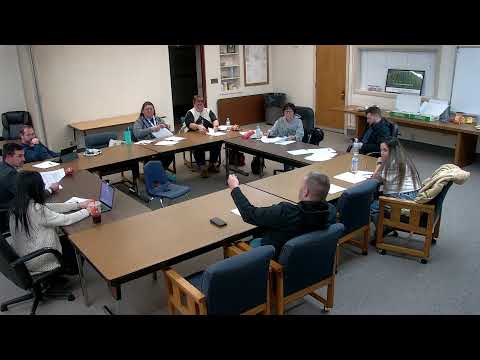
At the Feb. 2 work session, Nyssa SD 26 staff presented a winter analysis of NWEA MAP (K–12) results and framed the outcome as encouraging growth with outstanding areas of concern.
Presenter (Speaker 5) said the district’s MAP data show, in many elementary grades, growth that exceeds national norms even while some achievement measures remain below desired thresholds. He summarized the district’s historical SBAC performance as roughly 30–35% achievement and said the MAP growth pattern makes the district optimistic about future SBAC outcomes: "We're on track to have the best course in 10 years... If it's working, don't stop." (Speaker 5).
Speaker 5 explained the difference between growth and achievement: growth measures how many additional items students get correct from fall to winter compared with national peers; achievement indicates the absolute percentile (50th percentile is average). He illustrated that in some grades students moved from lower percentiles into the national norm band and that first grade showed notable improvement. He also flagged kindergarten and specific middle‑ and high‑school grade pockets as concerns that require targeted supports.
Board members asked for comparisons to last year and the presenter said this was the first year the district’s K–12 assessment system allowed consistent building‑level longitudinal tracking. Speaker 6 and others pressed for how to translate diagnostic data into instructional supports; presenter said the district’s data teams break results down to the classroom and student level to identify interventions.
Clarifying details noted in the meeting: presenter referenced district averages of roughly 35–38% achievement on historical metrics and said elementary math growth now aligns closer to the 50th percentile in some grades. Next steps include using data-team meetings to allocate interventions, follow-up with school leaders and monitoring SBAC outcomes when available.