Get email alerts on the District Finance topic
No spam. Unsubscribe anytime.
Business office reports February shortfalls, explains enrollment projection method
Summary
Business office presenter Miller reported FY26 February results showing Ed Fund expenditures exceeded revenues and outlined the five-year enrollment projection method; sales tax receipts and investment balances were highlighted.
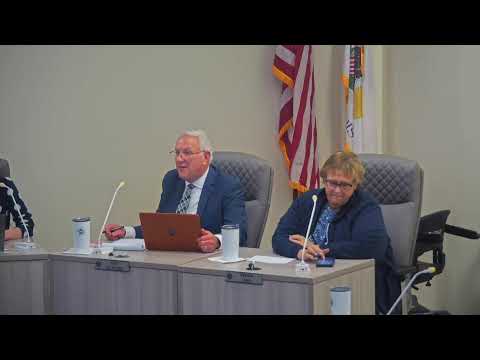
The district's business office reported February FY26 financials and walked trustees through enrollment projection methodology at the March 24 meeting.
Miller said Ed Fund revenues for February were $5,000,000 while FY26 Ed Fund expenditures were $13,600,000, meaning expenditures exceeded revenues by $8,600,000 for the month. He reported combined cash balances across funds of $51,600,000 and operating fund cash of $20,000,000; total investments were $53,600,000 and total balance of cash and investments across all funds was $105,000,000. Year-to-date interest earned on cash accounts for the month was recorded at $1,500,000 and the interest rate on cash accounts for February was 2.5%.
On sales tax, Miller said January sales tax proceeds were $1,400,000 (and the most recent month was $1,600,000), and that total collections since 2009 were $81,700,000. He also walked trustees through enrollment projections: the business office uses multiple data points including live births in Sangamon County, current enrollment, and a five-year survival-ratio method to estimate future kindergarten cohorts and grade-to-grade survival. Miller noted the district has seen some recent increases in enrollment inconsistent with the survival-based projections, and said that parochial-school eighth-grade graduates moving into ninth grade produced a spike (a 1.26 survival ratio at ninth grade in the presenter’s chart).
Miller said the operating funds' year-to-date expenditure percentage was 54.35% compared with a three-year average of 55.53% and that Ed Fund expenditures were at 57.51% compared to a three-year average of 56.1%.
The presentation closed with a reminder that projected enrollment data feed audits, ACFR reports and grant applications, and that the business office uses these projections for long- and short-term borrowing and materials ordering planning.
The presentation generated no immediate roll-call votes; trustees thanked the presenter and moved on to action items.
AI generated
The text on this page is AI generated. Summaries, highlights, analysis, and video transcripts are all produced from the original source material.
AI can make mistakes, so if you spot one, and we will fix it for everyone.
Note: the source content is unaltered by us. Any content source we link to, be it a video, an audio recording, or a document, is presented exactly as its publisher released it. That publisher is usually a government body, sometimes an individual official or another organisation.