Get Full Government Meeting Transcripts, Videos, & Alerts Forever!
Get email alerts on the Student Achievement topic
No spam. Unsubscribe anytime.
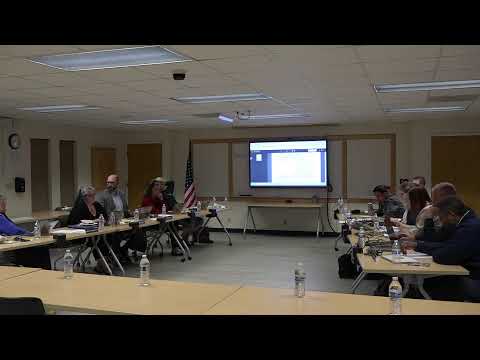
Kim Ferris, Chico Unified assessment director, presents state dashboard showing mixed results and pockets of growth
Summary
Kim Ferris, Chico Unified—s director of assessment and accountability, presented the 2023—24 California School Dashboard results: the district ranks above the state overall but saw declines in several indicators; suspension rates and some student groups improved while math and college-and-career indicators fell in parts of the district.
Kim Ferris, director of assessment and accountability for Chico Unified, told the school board the California School Dashboard gives a broader view of district performance than test scores alone and satisfies both state and federal accountability requirements. "The dashboard was set in place by California in 2017," Ferris said, and it combines status and change to assign a color rating for each indicator.
Ferris reported that Chico Unified—s average student scored 2.7 points above the state standard on the Smarter Balanced measures but cautioned that the district experienced declines in several areas. "While we—re doing great compared to similar schools, we don't want to see that decline," she said, pointing to drops in English language arts and math change scores and noting that 16 of 22 sites declined on at least one measure.
At the same time Ferris highlighted areas of strong growth: foster youth, American Indian and Alaska Native students, and several elementary schools including McManus and Citrus showed substantial year-to-year improvement. She said participation rates and small subgroup sizes can cause large swings in percentages for groups such as African American and foster youth and urged the board to consider multi-year trends.
Ferris reviewed key indicators: chronic absenteeism (TK—8) remains elevated districtwide since the pandemic (the state and district have not returned to pre-COVID levels), the suspension rate declined to 3.6% (a drop Ferris described as positive), and the district—s graduation rate stood at 90.5% (down 0.8 points from the previous year). On the college and career indicator (CCI), Chico Unified was in the yellow at 46.3% and down 0.7 points; Ferris said staff are auditing course coding and CTE documentation to ensure graduates receive the credit that counts toward CCI.
Board members asked about how the dashboard maps district data to local LCAP goals and whether supports are sustained beyond initial professional development. Ferris described an ongoing cycle: district staff begin reviewing preliminary scores in June, take a deeper look in August and use interim assessments (district IXL and site-level benchmarks) and tiered instructional supports throughout the year. "We have the same slide deck or similar slide deck from August, October, January and March," she said, describing repeated staff development and teacher collaboration time.
Ferris also summarized accountability implications: certain student-group red statuses can trigger county-led "differentiated assistance" at the district level and school-level CSI (comprehensive support and improvement) or ATSI (additional targeted support and improvement) designations under federal rules. She noted some sites exited CSI and ATSI this year while others remain eligible for support.
The presentation closed with staff offers to provide multi-year trend charts and deeper, school-level briefings. Ferris said the dashboard data will also be part of upcoming LCAP meetings with educational partners. The board did not take action during the informational workshop but directed staff to provide follow-up materials and one-on-one briefings on request.