Get Full Government Meeting Transcripts, Videos, & Alerts Forever!
Get email alerts on the Accountability Dashboard topic
No spam. Unsubscribe anytime.
Torrance Unified posts gains on 2025 California Dashboard but chronic absenteeism remains a focus
Summary
The district reported blue/green ratings on most dashboard indicators — ELA (68%), math (62%), College and Career Indicator (73.4%) and a 97% graduation rate — while chronic absenteeism slipped to orange. Staff outlined targeted interventions and attendance-monitoring steps to reach green next year.
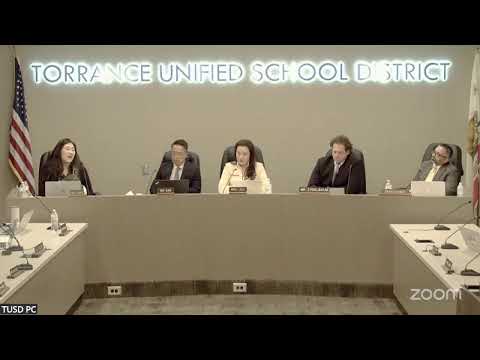
Torrance Unified staff gave the board an overview of the district’s 2025 California Dashboard on Jan. 20, reporting overall gains across multiple indicators but flagging chronic absenteeism as an area requiring additional attention.
Assistant Superintendent Dr. Isaiah told the board the dashboard shows the district in blue or green on most indicators. "We are at blue or green across all areas except chronic absenteeism," Dr. Isaiah said, reporting 68% of students met or exceeded English language arts standards and 62% met or exceeded in math — both cited as year-over-year gains. The College and Career Indicator (CCI) was reported at 73.4%; the graduation rate was reported as 97% (blue), the highest in district history.
Staff explained dashboard subgroup rules and data thresholds, including a 30-student minimum per subgroup for most indicators (15 students for foster/homeless youth). English-learner progress moved to green, with 59.8% showing progress (a 3.3 percentage-point increase). The district also reported growth for long-term English learners, foster youth, African American students and students with disabilities, while noting that growth was not uniform across every subgroup.
Chronic absenteeism was discussed at length: staff said the measure dipped to orange and described a plan to reduce the districtwide rate by 0.5 percentage points to reach yellow or green next year. Proposed steps include targeted interventions, additional TOSA support at elementary and middle sites, attendance-monitoring procedures led by student services, earlier family outreach and expanded before/after-school programs.
Trustees asked clarifying questions about how rankings are calculated and how the district will validate interventions. Staff said principals have used dashboard data to set site goals and that the district will incorporate dashboard results into Local Control and Accountability Plan (LCAP) priorities.
The board thanked staff and student leaders for the presentation and noted the dashboard will inform upcoming LCAP and budget decisions.