National Library of Medicine Region 7 hosts Power BI workshop using NCI HINTS data
Loading...
Summary
NNLM Region 7 hosted a virtual workshop showing how to build interactive dashboards in Power BI Desktop using a subset of the National Cancer Institute's Health Information National Trends Survey (HINTS). Presenter Jocelyn Swick Jemison demonstrated cards, charts, slicers and a key-influencers analysis and answered participant questions on data formats, deidentification and sharing.
Kimberly Carlo of Region 7 of the National Library of Medicine opened a virtual workshop announcing a Power BI demonstration using a subset of the National Cancer Institute's Health Information National Trends Survey (HINTS) and introduced Jocelyn Swick Jemison, data services librarian at the University at Buffalo, as the presenter.
Jemison said the session was a demonstration and not a full course in the software: "This is really a demonstration. This is a very robust and powerful tool, that really can't be covered in an hour," and outlined the plan to import a dataset, build visuals and explore interactive filtering.
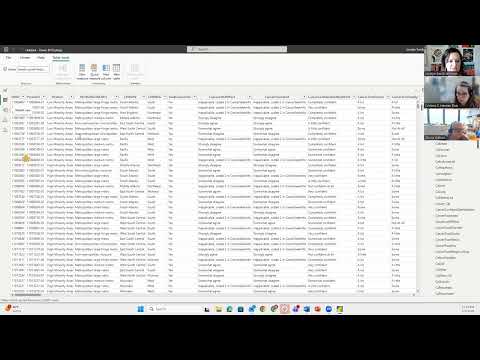
Using Power BI Desktop, Jemison imported an Excel table and showed how to build card visuals to display key counts. She demonstrated a card for total respondents (3,865), a card filtered to respondents who said they use the internet (3,148), and a card for respondents who sought cancer information in the past year (1,868). She explained how to add visual-level filters so cards report only the intended responses.
Jemison then created charts: a clustered bar comparing self-reported general health across the four U.S. census regions and a donut chart showing where respondents said they go for cancer information. She stressed the interactivity of Power BI visuals, clicking a subset (Southern-region respondents reporting "very good" health) to filter the dashboard and report the subset counts (about 584 people; 510 used the internet; 295 sought cancer information).
The presenter introduced slicers to let users filter by region and by birth gender, and discussed layout options for slicer buttons. For analysis beyond descriptive charts, she demonstrated Power BI's key-influencers visual and its model-driven narratives: "If they reported that their education level was post-baccalaureate, they are 1.23 times more likely to be Internet users," she said, and noted that respondents who did not finish high school were 3.58 times more likely to report not using the Internet. Jemison framed these outputs as exploratory associations generated by behind-the-scenes logistic-style models.
On data handling, Jemison advised that transforming data in Power BI does not change the original Excel file by default but can be arranged to do so, and recommended cleaning data in tools such as OpenRefine prior to analysis when appropriate. She confirmed Power BI can generate surrogate IDs to preserve anonymity and said publicly shared government datasets that are deidentified can be analyzed with AI tools, but warned against using AI on sensitive, nondeidentified health data.
Jemison demonstrated publishing a report to a personal workspace (SharePoint/web), showed how published dashboards appear in a browser for viewers without edit permissions, and explained embedding options for websites and PowerPoint. She told participants she will share example dashboards and the step-by-step lesson materials after the session.
Organizers closed by reminding attendees about a survey required to receive MLA continuing education credit and noting interest in follow-up classes on advanced Power BI features and visualization styling. The session ended with thanks and an offer to answer follow-up questions by email.