Get Full Government Meeting Transcripts, Videos, & Alerts Forever!
Get email alerts on the Public Safety topic
No spam. Unsubscribe anytime.
Bozeman Police launches interactive data dashboard, pledges monthly public reports
Summary
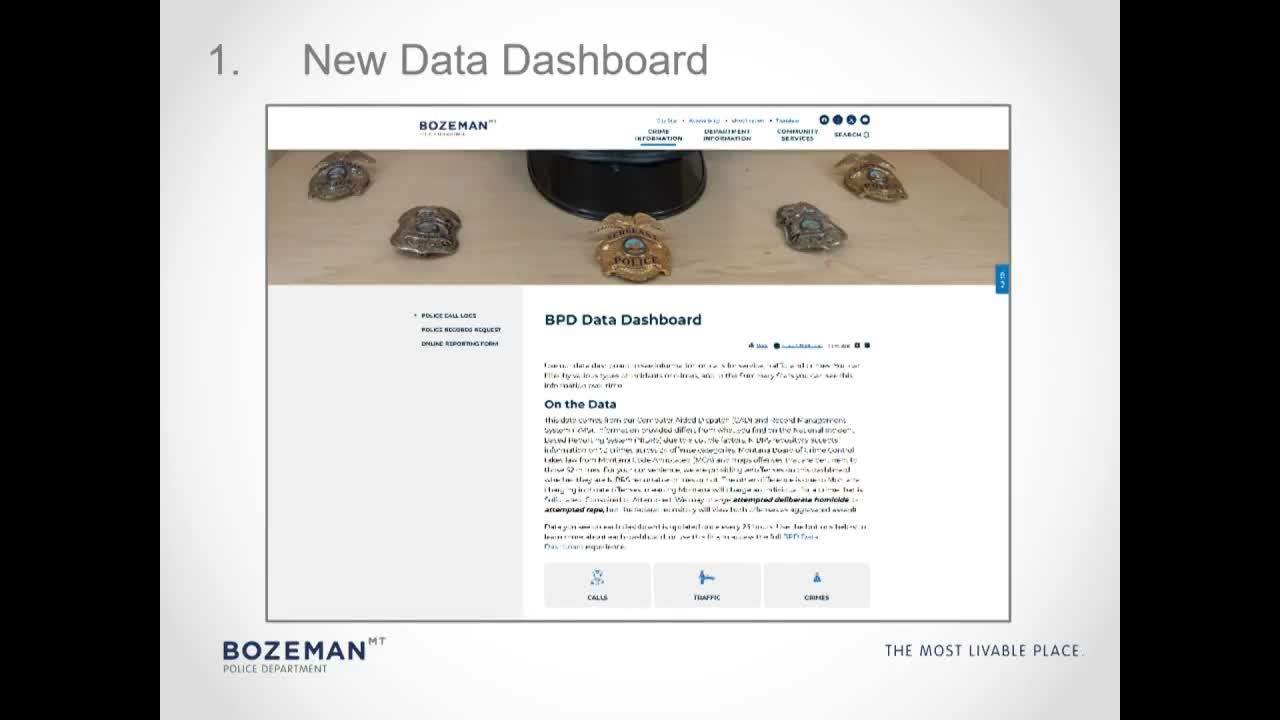
Police Chief Jim Belkamp unveiled a new interactive BPD data dashboard and a plan for monthly reports, aiming to increase transparency on calls, cases and traffic stops; the dashboard went live during the Oct. 7 commission meeting.
Bozeman Police Chief Jim Belkamp told the City Commission on Oct. 7 that the department is launching a new interactive data dashboard and a monthly reporting program to share calls-for-service, case and traffic statistics with the public.
Belkamp described the dashboard as an interactive mapping tool on the department web page that displays calls for service, crimes and traffic incidents by date and category. The dashboard includes a video tutorial and allows residents to zoom to neighborhoods and view nearest intersections rather than precise house-level locations.
The chief said the department receives about 45,000–50,000 calls for service annually and opens roughly 4,500–5,000 cases each year. He called the dashboard a preliminary tool that will be refined over time and said the department will pair the online dashboard with a short monthly report that highlights call and case data, trends and department happenings.
Belkamp also said the department plans to expand social-media outreach and post regular call-for-service snapshots and targeted requests for community information when appropriate. Commissioners praised the initiative and asked whether future monthly reports could include victim and arrestee demographics and per-capita trend comparisons; Belkamp said those are promising items for the monthly report even if they are difficult to fully integrate into the live dashboard immediately.
Ending
Commissioners thanked the chief and staff for the dashboard and asked staff to consider including trend summaries and demographic context in future monthly reports.