Get Full Government Meeting Transcripts, Videos, & Alerts Forever!
Get email alerts on the Student Assessment topic
No spam. Unsubscribe anytime.
Principals say midyear iReady data show gains but flag K–3 intervention needs
Summary
District principals told the Laconia School Board that winter iReady diagnostics and data walls show measurable midyear growth but also flag dyslexia indicators in some K–3 students, prompting targeted interventions and requests for clearer reporting on outliers and medians.
Principals and district presenters told the Laconia School Board on March 3 that midyear iReady diagnostic results show progress in several grades but continue to identify students who need targeted intervention.
A principal who led the presentation said the district uses iReady three times a year for diagnostics and to generate individualized MyPath lessons. “When a student takes a diagnostic assessment, they’re going to get their scale score,” the presenter said, adding that teachers set growth goals — either a typical one‑year growth or a higher “stretch” goal for students behind grade level.
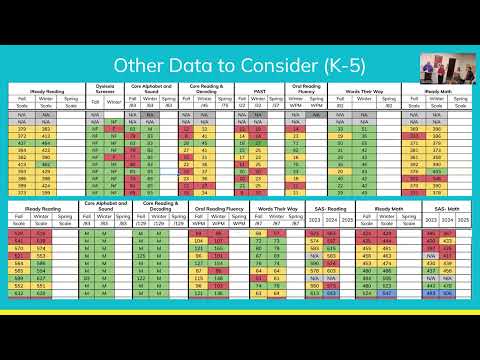
Presenters showed elementary data walls that combine fall and winter iReady scores with other literacy measures. One presenter noted kindergarten winter results shifted noticeably: “you can see with kindergarten… they went from 0 to 18%” at or above grade level in the winter snapshot, and the presenter described similar positive shifts in first and second grades.
The iReady dyslexia screener was raised as a particular point: presenters said K–3 students below the 20th percentile are flagged for follow‑up. “That means that they have been flagged as having an indicator of a reading related challenge,” a presenter said, and staff cross‑check that flag against other assessments before assigning interventions.
Board members pressed for additional detail on how results are presented. One board member asked whether the charts include outliers and why the district reports median progress rather than an average; a presenter replied that charts include all students and that median is used because it better represents the middle of the distribution when outliers skew averages. The board member requested the administration provide alternate views (for example, median and mean, or a chart highlighting outliers) for future reports.
Presenters described classroom‑level follow‑up: iReady’s MyPath provides immediate lesson assignments, and teachers monitor whether students pass lessons or need adjustments. The presenters said MyPath also flags students who repeatedly fail a lesson so staff can create small‑group interventions.
The board did not vote on instructional changes at the meeting; presenters said the district will re‑examine combined assessment results at the end of year diagnostics in June and report back on how winter gains translate to year‑end proficiency.