Get Full Government Meeting Transcripts, Videos, & Alerts Forever!
Get email alerts on the School Performance topic
No spam. Unsubscribe anytime.
Oakdale Joint Unified reviews 2024 School Dashboard; highlights gains and subgroup concerns
Summary
District staff presented the California 2024 School Dashboard, noting site-level improvements in chronic absenteeism and some ELA gains but flagged declines in English learner progress and math for students with disabilities and socioeconomically disadvantaged subgroups.
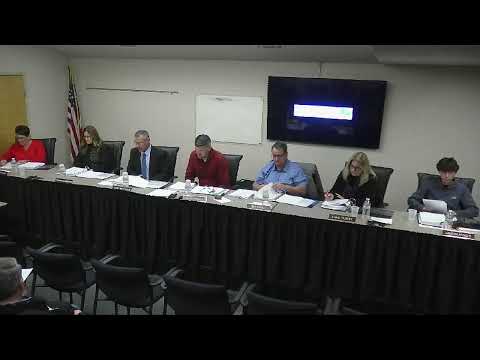
District staff presented the 2024 California School Dashboard to the Oakdale Joint Unified School District Board of Trustees, highlighting both improvements and remaining challenges across district sites.
The presenter explained the dashboard’s color-coded indicators — blue as the highest performance and red the lowest — and said several sites saw reductions in chronic absenteeism and suspension rates, which the district characterized as positive trends. The presenter noted that “we are continuing to see those numbers go down,” and pointed to specific schools that moved from yellow to green or from orange to green in ELA and math designations.
At the same time, staff identified areas of concern among specific student subgroups. The presentation called out declines in English learner (EL) progress at one site, noting a “significant declination” of 10.1 points in EL progress that pushed that site’s indicator into the red. Staff also said students with disabilities and socioeconomically disadvantaged students appear disproportionately in lower performance categories in some schools.
The dashboard review included school-by-school summaries. The presenter said Cloverland maintained a yellow rating overall while improving in ELA, Phro (another elementary) moved into green in both ELA and math, and one junior high moved several historically red subgroups out of the red category — changes the presenter described as “fantastic improvements.” The presenter also said the high school’s graduation rate and college-and-career readiness indicators showed areas of progress and areas needing work; overall college-and-career readiness was reported at roughly the mid-40s percentage for the district, with the presenter saying “we need to work harder with our students with disabilities.”
Trustees asked clarifying questions about how the dashboard counts status versus change and how small subgroup sizes affect color assignments. Staff directed trustees to the publicly available district dashboard website and offered to meet individually with members who wanted deeper, site-level analysis.
The presentation closed with staff noting strong participation rates on state assessments (reported in the presentation as 97% participation in ELA and math and 94% in science) while cautioning that some small subgroups remain below the 95% participation threshold that avoids subgroup penalties. The board received the dashboard presentation and did not take separate formal action during this agenda item.