Get Full Government Meeting Transcripts, Videos, & Alerts Forever!
Get email alerts on the American Community Survey topic
No spam. Unsubscribe anytime.
Census webinar explains ACS estimates, margins of error and how to test differences
Summary
Caleb Hopler of the U.S. Census Bureau walked webinar attendees through how the American Community Survey produces estimates, how margins of error (MOEs) are calculated and used, the Census statistical‑testing tool and special notations on data.census.gov.
Caleb Hopler, a presenter from the American Community Survey Office at the U.S. Census Bureau, used a public webinar to explain how ACS estimates are produced, why margins of error matter, and how data users can test whether two estimates are statistically different. "An MOE is a measure of the possible variation of the estimate around the population value," Hopler said, noting the Census Bureau reports MOEs at a 90 percent confidence level on data.census.gov.
Hopler emphasized why MOEs matter to local decision‑making: ACS data inform the distribution of federal funds and numerous program and planning decisions. He said the ACS samples about 3.5 million housing-unit addresses and roughly 150,000 group‑quarters residents each year and produces 1‑year and 5‑year products for different geographic sizes.
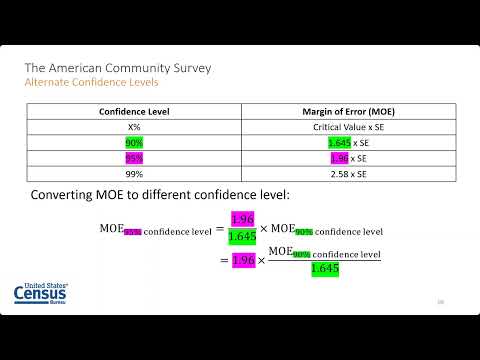
The webinar explained how MOEs are computed from the variance and standard error (SE) and that Census multiplies SE by 1.645 to produce a 90 percent MOE. Hopler demonstrated converting a 90 percent MOE to a 95 percent MOE by multiplying by the ratio 1.96/1.645, and showed that higher confidence levels increase the MOE.
Using table S0101 (age and sex) for Maryland, Hopler illustrated confidence intervals by adding and subtracting the MOE — for example, a row for males under age 5 produced a 90 percent interval the presenter gave as 174,797 to 179,297. He then walked through a block‑group median‑income example (median $37,284, MOE $20,922) to show how wide MOEs can make apparent differences indistinguishable without testing.
To help users make comparisons, Hopler reviewed the Census Bureau's free Excel statistical‑testing tool (two tabs for pairwise and multiple comparisons, with worked examples) and demonstrated examples: comparing the U.S. median age (39.2) with New York State (40.1) and a set of hypothetical block groups. He also showed the manual Z‑score approach using MOEs — square each MOE, sum them, take the square root, divide the absolute difference of estimates by that result — and noted that a Z‑score greater than 1 means two estimates differ at the Census' 90 percent confidence standard.
Hopler reviewed special notations users may encounter on data.census.gov: controlled estimates shown with five stars (*****) where users should treat the MOE as zero for testing; zero estimates that nonetheless have non‑zero MOEs; suppressed estimates shown as "-" with two stars for the MOE; and open‑interval medians shown with a plus or minus and three stars for the MOE. He cautioned that certain cases cannot be tested and that the testing tool recognizes these notations.
For derived totals, Hopler demonstrated a commonly used MOE approximation: square the component MOEs, sum the squares, and take the square root of the sum. He also noted variance replicate estimate tables as an advanced resource that include covariance and can yield more accurate MOEs for derived estimates.
Hopler closed by pointing attendees to census.gov/acs for technical documentation (including "Accuracy of the Data" and "Worked Examples for Approximating Margins of Error"), the Census API, My Tribal Area, the Census Academy training hub, and an email for support (acso.users.support@census.gov). The webinar ended after a brief Q&A and a handoff back to the host, Anthony.