Get Full Government Meeting Transcripts, Videos, & Alerts Forever!
Get email alerts on the Education Funding topic
No spam. Unsubscribe anytime.
Census Bureau webinar shows how school districts can use ACS data to predict enrollment and assess tax capacity
Summary
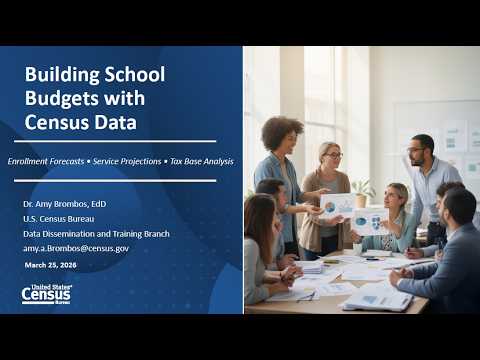
At a U.S. Census Bureau webinar, a data dissemination specialist demonstrated how age, housing and mobility tables on data.census.gov and ACS products can help districts forecast K–12 enrollment, analyze tax-base vulnerability, and prepare more defensible budgets.
Dr. Amy Brombos, a Data Dissemination Specialist with the U.S. Census Bureau, told school administrators and budget officials in a webinar that Census Bureau data can provide 3–5 year warning systems for enrollment and tax-base shifts and make budget requests more defensible.
Brombos opened the demonstration by contrasting internal district records, which “tell you what has happened,” with census measures that can indicate what is likely to happen. “The good news is that there's a solution and that's census data,” she said, urging attendees to use age, household composition, housing type and mobility indicators to forecast enrollment and plan budgets.
Using Hartford, Connecticut as an example, Brombos showed how five-year American Community Survey (ACS) tables can reveal population shifts in the 0–5 age cohort. She noted the S0101 and S0901 tables and said the 2013–2017 five-year estimate showed 8,202 children under five while the 2018–2022 five-year estimate showed 6,582 — a decline of about 1,620 children, roughly 20 percent. She translated that pipeline decline into likely school entrants and noted that, historically, about 94–95 percent of children enter public schools, offering a way to convert age-population changes into expected enrollment impact.
Brombos demonstrated navigating data.census.gov: selecting a unified school district geography, choosing the appropriate tables (age and sex, children characteristics, school-enrollment tables such as S1401), and downloading multi-year data in a zip file for year-by-year comparison. She emphasized paying attention to margins of error for smaller geographies and using five-year ACS estimates where appropriate to reduce statistical noise.
Beyond raw headcounts, the presentation highlighted housing and tax-base indicators officials should examine: household size changes (an example she showed moved from 2.65 to 2.23), share of renter-occupied housing versus owner-occupied, bedroom counts (studio/one-bedroom shares rose from ~30.5% to 32% in the example), median home values, and gross rent as a percentage of income. Those measures, Brombos said, matter when districts consider proposing tax increases: a hypothetical 4% tax hike that would raise about $6 million (roughly $312 per homeowner annually, in her example) can provoke strong public reaction if income distribution and cost-burden are not considered.
In a brief Q&A, participant Nicole asked, “Is there a table that shows enrollment for charter schools?” Brombos replied that charter enrollment data are not in the data.census.gov portal used in the demo and recommended consulting the National Center for Education Statistics (nces.ed.gov) for charter-specific enrollment data. When asked whether Census Bureau data are reliable for small districts, Brombos explained that five-year ACS estimates are designed for smaller geographies and that margins of error should be examined to distinguish real change from statistical noise.
Brombos closed by listing additional indicators (English proficiency, disability by age, SNAP participation, poverty) and tools such as SAIPE (used for Title allocations) that can assist grant writers and budget planners. She offered follow-up support through the Census Data Dissemination Program and Census Academy, and Krystal Jimerson closed the webinar by noting that the presentation, screenshots and the recording will be posted and asking attendees to fill out an evaluation.
The webinar focused on practical steps—filtering by geography, choosing the correct ACS table, accounting for margins of error, and combining age and housing indicators—to help districts translate demographic trends into actionable budget planning and community-facing justifications for tax and spending proposals.