Get Full Government Meeting Transcripts, Videos, & Alerts Forever!
Get email alerts on the Nass Methodology topic
No spam. Unsubscribe anytime.
NASS official Lance Honig explains how USDA crop estimates are made, urges producers to return surveys
Summary
Lance Honig, head of methodology at the National Agricultural Statistics Service (NASS), outlined how NASS combines large producer surveys, objective yield plots, satellite products and administrative records to produce U.S. crop estimates and urged farmers to prioritize returning surveys to maintain county‑level coverage.
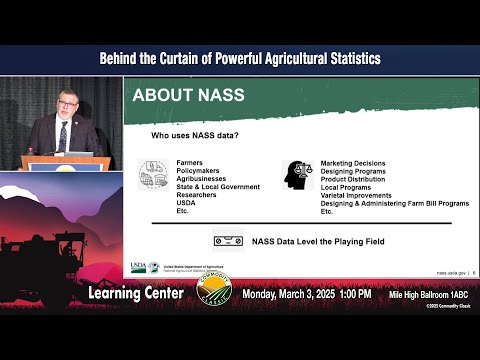
Lance Honig, chair of the Agricultural Statistics Board and director of the Methodology Division at the National Agricultural Statistics Service (NASS), told an audience that NASS relies on a mix of large sample surveys, objective field plots, satellite products and administrative records to produce the monthly crop estimates that inform markets and policy. "Our mission is…to provide timely accurate and useful statistics in service to U.S. agriculture," Honig said.
Honig described three cornerstone survey sources for row crops: large quarterly agricultural surveys (about 55,000–75,000 sample cases on the big quarter survey used to estimate final acreage, yield and production), shorter monthly yield surveys (the largest monthly sample around 14,000 in August) and objective yield plots (roughly 1,500 corn plots across 10 states that are measured and partially harvested for lab analysis). He said those producer reports remain the primary foundation for NASS estimates during the growing season.
Satellites and the Cropland Data Layer supplement the surveys by providing broad acreage coverage and fast, modeled yields. Honig cautioned that satellite‑based models are quick but can lose reliability when conditions deviate from normal: "If things are perfectly normal…this will work very well, but when was the last time everything was very normal?" He said satellite measures are a valuable supplement but not a replacement for producer reports and field plots.
Honig also discussed administrative data sources such as Farm Service Agency (FSA) certified acreage and Risk Management Agency (RMA) insurance records. He said FSA certified acreage provides excellent coverage — "greater than 98% coverage for some crops" — and becomes the primary planted‑acre source once sufficiently complete, but it is generally not available early enough in the season to replace prospective planting and acreage reports NASS publishes in March and June. RMA and other administrative sources can be useful for later‑season reconciliation but often arrive only after the marketing year.
To reconcile different inputs, NASS uses balance‑sheet accounting and stock surveys. Honig said on‑farm and commercial stocks surveys feed the balance sheet and can lead NASS to revise prior estimates when post‑season accounting shows meaningful differences: "If the balance sheet tells us something different at the end of the season we want to…adjust to provide the most accurate measure." He framed revisions as an effort to improve historical accuracy and future estimates.
Honig emphasized the practical effect of survey response on publishability and local accuracy. Using maps, he illustrated that missing responses (for example, a drop from full response to about 60% overall) make county‑level estimates less reliable or unpublishable and can also affect state and national figures. When asked about target response rates, he said NASS uses roughly an 80% target for the large agricultural surveys and typically sees mid‑70s response on monthly yield surveys. "The higher the better obviously…we should set a goal of 80%," he added.
On transparency, Honig highlighted NASS practices intended to make methods and uncertainty visible: pre‑published release schedules and lockups for market‑sensitive reports, price‑reaction tracking charts showing post‑report price moves, methodology and quality‑measure reports that include sample sizes and coefficients of variation, a Stat Chat Q&A series on X shortly after major releases, and publicly available one‑pagers and deep dives on the NASS website. He encouraged attendees to visit NASS booth 720 for follow‑up questions.
During audience Q&A, Honig addressed budget concerns and said NASS works to be efficient within available funding; he agreed machine learning and AI methods are already being used and may offer increasing opportunities for processing and modeling. On acreage converted to solar, he said routine crop surveys ask about acres actually used to grow crops and that solar‑covered acres generally should not be counted as crop acreage in those monthly or quarterly estimates, though the five‑year Census of Agriculture can capture such land‑use changes in greater detail.
The presentation concluded with an invitation to follow NASS online, attend lockup briefings or participate in Stat Chat sessions for further explanation of methodology and results.