Get Full Government Meeting Transcripts, Videos, & Alerts Forever!
Get email alerts on the Survey Design topic
No spam. Unsubscribe anytime.
Andrea Lubin: Accessible survey design boosts participation for disability and aging programs
Summary
Rutgers researcher Andrea Lubin outlined practical survey techniques — clear goals, accessible formats, partner dissemination and minimized respondent burden — that helped secure large response rates and produce policy‑relevant findings for programs serving people with disabilities and older adults.
Andrea Lubin, a policy researcher at Rutgers and director of the New Jersey Travel Independence Program (NJTIP), told webinar attendees that well‑designed surveys paired with partner outreach are essential to gather reliable data from people with disabilities and older adults.
Lubin said surveys can produce generalizable, quantitative evidence while focus groups and interviews provide deeper context; many projects benefit from both methods. “Surveys are an example of quantitative research,” she said, adding that combining approaches lets researchers collect broad metrics and then “dig deeper” into lived experience through follow‑up discussions.
Her team’s 2015 New Jersey study of transportation experiences for adults on the autism spectrum received 703 responses and yielded policy recommendations that continue to be used in advocacy. Lubin credited targeted partner outreach — centers for independent living, ARC chapters, transit agencies and district offices — and clear communication of the survey’s purpose with driving that response.
Lubin urged survey creators to set clear goals and to keep only questions that serve those goals. She warned against multi‑part questions disguised as a single item, which increase respondent burden and reduce completion rates. “Don’t include any questions unless they have a use and value to you,” she said.
Accessibility is a priority, Lubin added: use high‑contrast fonts, provide alternative text for images, ensure compatibility with screen readers and test surveys on phones and tablets. She recommended platform accessibility checkers (for example, Qualtrics and others) and emphasized pretesting with people similar to the target respondents to detect confusing wording or design obstacles.
On question type, Lubin favored mostly multiple‑choice formats for ease of response and analysis, with selective open‑ended items to capture nuance. Her team frequently used five‑point Likert scales to measure degrees of agreement and preserve a neutral midpoint. She also recommended offering an “other” response with a text box where appropriate, rather than forcing respondents into ill‑fitting categories.
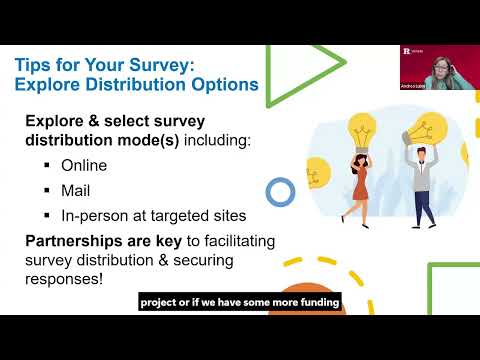
Finally, Lubin stressed the role of partnerships in dissemination. When budgets are limited, online surveys are cost‑effective, but boosting response rates often requires mailed copies, drop‑offs at trusted community sites, or staffed tables at events. “The partnerships really helped us get the word out,” she said. “Let people know what you’re trying to learn and what you will do with the data.”
The session closed with Lubin offering to take follow‑up questions by phone or email and handing the webinar to Bright Side Family presenters to describe how they applied these principles in Teaneck.