Get Full Government Meeting Transcripts, Videos, & Alerts Forever!
Get email alerts on the American Community Survey topic
No spam. Unsubscribe anytime.
Census webinar explains how the American Community Survey measures the U.S. workforce
Summary
The U.S. Census Bureau hosted a webinar demonstrating how the American Community Survey collects employment, industry, occupation and commuting data, how to use data.census.gov and mapping tools, and when to choose 1-year versus 5-year estimates for analysis.
Crystal Jimerson, a training specialist at the U.S. Census Bureau, opened a Census Academy webinar and introduced statistician Lacey Lofton, who explained how the American Community Survey (ACS) measures employment and related topics and demonstrated tools on data.census.gov.
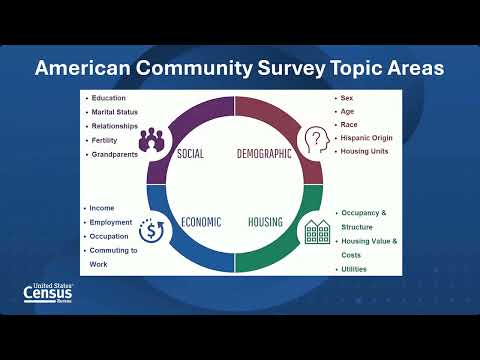
Lofton described the ACS as the bureau’s largest household survey, saying: “we send questionnaires, or an invitation to respond to about 3,500,000 households every single year,” and including group‑quarters to produce annual estimates of how people live and work. She outlined the survey’s topic groups—social, demographic, economic and housing—and said the webinar would focus on economic measures such as employment status, class of worker, industry, occupation and commuting.
Lofton emphasized that geography is fundamental to interpreting ACS results and listed the many geographic levels available—from national and state down to census tracts and block groups maintained by the U.S. Census Bureau. She explained the difference between 1‑year and 5‑year ACS releases: 1‑year estimates reflect a single calendar year and are most current, while 5‑year estimates aggregate five years of data, are released later and offer smaller margins of error. “One‑year estimates are only available for geographies with 65,000 or more people,” she said, noting the threshold exists to preserve reliability and confidentiality.
Using the data.census.gov explore filters, Lofton demonstrated building tables (she selected the DP03 economic characteristics profile), choosing geographies and switching between estimates and percentages. She walked through table elements and cautioned users to check the margin of error (90% confidence interval) for each estimate. As national examples, she cited an estimated population 16 and over of 276,249,478, with 64% in the labor force, 60.6% employed and 2.9% unemployed; on commuting she noted 69.2% drive alone and 13.3% work from home.
In the mapping demo Lofton showed how to shade states and counties by a selected variable (labor force, armed forces concentration, public transit use) and offered examples such as New York’s public‑transit commuting share (24.2%). Drilling down to Texas counties, she showed occupation and industry distributions and cited Martin County where 26.2% of workers are in agriculture, forestry, fishing and hunting, and mining.
In audience Q&A Lofton recommended 1‑year estimates for large geographies or places experiencing rapid change (new factories, post‑disaster shifts) and 5‑year estimates for smaller areas or when steadier estimates are needed. She also clarified that ACS commuting questions measure travel to and from work only, and that separate household items in ACS report vehicle access for broader mobility and emergency‑evacuation concerns.
The webinar concluded with a reminder that the recording, transcript and Q&A will be posted to the Census Academy site; attendees were invited to follow up with regional staff for place‑specific questions.