Get Full Government Meeting Transcripts, Videos, & Alerts Forever!
Get email alerts on the PFAS Monitoring topic
No spam. Unsubscribe anytime.
Delaware River Basin Commission releases PFAS report and interactive data app, flags a spike near Pea Patch Island
Summary
The Delaware River Basin Commission presented a three-year PFAS monitoring report and a public web app that compiles more than 2,000 samples; staff said PFAS concentrations and total mass rise downstream with a notable increase between Chester and Pea Patch Island and that PFOS dominates fish tissues.
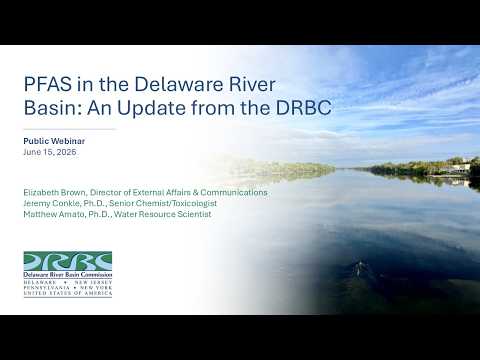
The Delaware River Basin Commission released a technical report and an interactive web application on PFAS monitoring in the basin, presenting results from a three‑year sampling effort and tools for public and agency data review.
Jeremy Konkel, senior chemist and toxicologist at the Delaware River Basin Commission, said the analysis shows PFAS concentrations generally increase moving downstream and that the total mass of PFAS in surface water grows as well, with a pronounced rise in inputs between Chester and Pea Patch Island. "PFAS is a major issue in the Delaware Basin," Konkel said, noting that Pea Patch Island (near River Mile 60) showed consistent compound suites and similar concentrations across 2021–2023 samples.
Why it matters: the river supplies drinking water, supports aquatic life, and crosses state lines, so basin‑scale trends can affect multiple water utilities and habitats. Konkel emphasized these are surface‑water measurements, not finished drinking water, and said state agencies set consumption advisories: "If you go out fishing a lot and you regularly eat the fish that you're catching, we highly recommend to consult your state's consumption advisories," he said.
Key findings from the report and presentation
- Scope and sampling: DRBC staff collected surface water, sediment, fish tissue (multiple species), and passive sampler data across a roughly 200‑mile stretch of the river; most samples cited in the presentation were collected in late 2023 and analyzed using EPA method 1633 at a contract laboratory.
- Downstream trend and hotspot: Konkel described a general downstream increase in measured concentrations and an exponential increase in PFAS mass per river mile through the estuary, with a marked jump near Pea Patch Island. He said that pattern implies one or multiple PFAS inputs between Chester and Pea Patch Island, while tidal dynamics can complicate source attribution.
- Sediment and localized sources: sediment concentrations were more spatially variable and often reflect nearby discharges or outfalls; Konkel highlighted an outfall site near the Philadelphia Airport with a very high sediment PFAS measurement in one sample, though repeat sampling at that station yielded lower concentrations, underscoring sampling variability.
- Fish tissue: DRBC sampled several species across tidal and non‑tidal zones and reported PFOS is the dominant compound in tissues. Konkel noted DRBC does not set consumption advisories and directed anglers to state advisories (he cited New Jersey and Pennsylvania as examples).
- Drinking‑water benchmark context: Konkel explained that some surface‑water samples in drinking‑water zones 2 and 3 exceeded a 4 ng/L reference threshold used for PFOS and PFOA in drinking water, but stressed that the study measured surface water, not treated tap water, and that most samples in those zones were below 4 ng/L.
New public tool and data access
Matt Amato, water resource scientist at the Delaware River Basin Commission, demonstrated the Delaware River Basin PFAS data app, which compiles publicly available PFAS monitoring data sourced from EPA's Water Quality Portal and USGS water data services. The app includes filters by sampling media (surface water, groundwater, sediment, tissue), compound or compound group, species for tissue data (17 species), and time frame; Amato said the app aggregates more than 2,000 PFAS samples and will be updated regularly as new data are uploaded.
Amato walked through map symbology, pop‑up site details, histograms that update with map view, an estuary analyzer (plots by DRBC river mile), and a watershed averaging feature that reports average concentrations and sample counts by watershed. He encouraged monitoring organizations to upload data to the EPA portal so DRBC can ingest it into the app.
Next steps and limitations
DRBC staff described a three‑step roadmap: continue consolidating and assessing publicly available PFAS data; pursue targeted follow‑up sampling and small‑scale source tracking in tributaries where signals indicate hotspots; and, with state and federal partners, work toward actions that reduce PFAS loading. Konkel acknowledged funding limits and said additional grants will be pursued. He also cautioned that some portal data can be provisional or flagged, and suggested users verify data for specific regulatory or management purposes.
Selected direct quotes
"PFAS is a major issue in the Delaware Basin," Jeremy Konkel said, summarizing the scale and persistence of the chemicals in the basin.
"The app compiles data from EPA's water quality portal and USGS's water data API," Matt Amato said, describing the app's data sources and its goal of making monitoring data more accessible.
What happens next
DRBC will post the webinar recording and slides, keep the web app updated as new monitoring data are uploaded, and pursue targeted sampling and source‑tracking studies where funding allows. The commission urged stakeholders and monitoring agencies to contribute data via EPA's Water Quality Exchange to improve coverage and source identification.