Get Full Government Meeting Transcripts, Videos, & Alerts Forever!
Get email alerts on the Restoration Evaluation topic
No spam. Unsubscribe anytime.
Student stream team: Centerville restoration appears to be maturing despite heavier 2024 rains
Summary
University of Wisconsin–Green Bay Manitowoc students and partners reported summer 2024 monitoring of three Manitowoc County watersheds, finding restoration zones held stable phosphorus and dissolved-phosphorus levels despite higher rainfall and spikes in turbidity during rain events.
University of Wisconsin–Green Bay Manitowoc student researchers presented summer 2024 stream-monitoring results at the Lakeshore Water Summit, saying the Centerville Creek restoration appears to be maturing and generally handling higher, more intense rainfall in 2024.
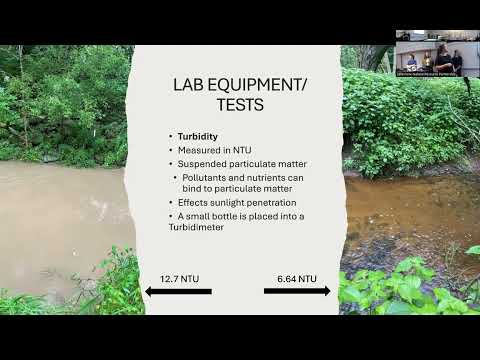
The presentation, led by Ashley Mint (lead data analyst, environmental science major), outlined a weekly sampling protocol plus targeted sampling within 24 hours of rain events of at least 0.5 inches. The team monitored three watersheds—Little Manitowoc, Pine Creek and Centerville Creek—measuring flow, dissolved oxygen (DO), turbidity, ammonia/ammonium, pH, total phosphorus and dissolved phosphorus, and E. coli concentrations using QA/QC procedures aligned with Wisconsin DNR guidance. The presenters said the restoration zone’s dissolved oxygen target is above 5 mg/L and the phosphorus standard used was 0.075 mg/L.
Why it matters: the students said that although 2024 had substantially more and more intense rainfall than 2022, turbidity patterns in Centerville’s restoration zone looked similar across years, which the team interprets as evidence the restored segment is increasingly resilient. "This is a good sign that the restoration is maturing and being able to handle this increased rain and this increased intensity of rain," Morgan Burnside said.
Key findings summarized by the team included: rain events raise turbidity markedly compared with nonrain conditions; total and dissolved phosphorus in the Centerville restoration remained low and stable across years and during rain events; and some sites showed counterintuitive differences—eg, Little Manitowoc was often low for phosphorus but sometimes reached detection limits for E. coli during rain events. Timber Cot, who led the rain/land-use analysis, said charts showed Little Manitowoc near detection limits in many rain samples while Centerville tended to be higher during nonrain conditions in some metrics.
Methods and caveats: the students explained field methods (flow meters, DO probes, NTU turbidimeter) and lab approaches (incubation for E. coli, spectrophotometry for phosphorus) and cautioned about equipment and sampling limits. They noted the laboratory E. coli detection limit used in their reporting is 2,419.6 CFUs and that the surface-water E. coli thresholds they applied are 0–234 CFU (open), 235–999 CFU (advisory) and ≥1,000 CFU (closed). The team emphasized QA/QC checks and that some sampling gaps (for example, not all restoration sites were sampled in 2021 because of access) influence year-to-year comparisons.
Context and next steps: presenters identified storm drains and localized land-use differences as potential drivers of U-shaped turbidity profiles inside the restoration. They recommended continued, multi-year monitoring to confirm trends and suggested adding targeted tests (such as iron and additional chemical contaminants) and more systematic biological observations (fish and macroinvertebrates) in future seasons.
Quotations: "Everything that we're testing does lead into Lake Michigan," Ashley Mint said, underscoring the regional link between tributary health and the lake. "This is a good sign that the restoration is maturing," Burnside added when comparing 2022 and 2024 turbidity graphs.
What’s next: the team invited community partners and regulators to continue data-sharing and to support further testing; they confirmed QA/QC data are submitted to the Wisconsin DNR and that the program feeds into broader regional datasets.