Get Full Government Meeting Transcripts, Videos, & Alerts Forever!
Get email alerts on the Benchmarking Tool topic
No spam. Unsubscribe anytime.
Slipstream demos benchmarking 'calculator' to Evanston committee as members weigh local targets
Summary
At a June 17 Evanston Healthy Buildings technical committee meeting, a Slipstream team demonstrated a benchmarking calculator built from four years of Energy Star Portfolio Manager data to help set local EUI targets; members agreed to test the tool and return with scenarios ahead of mid‑July emissions analysis.
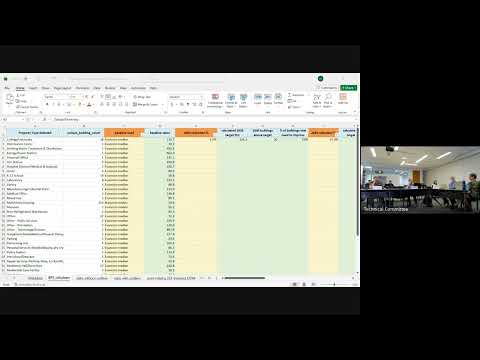
At a June 17 meeting of the Evanston Healthy Buildings technical committee, a presenter from Slipstream demonstrated an interactive ‘calculator’ that uses four years (2021–2024) of Energy Star Portfolio Manager data to model energy‑use intensity (EUI) targets for buildings in Evanston.
The presenter said the tool shows results by Energy Star property type and lets committee members toggle baselines, change glide‑path percentages and see how many buildings would be above or below a given target. “What we ended up creating, in addition to showing you what the UIs are based on the data that we currently have, is a tool, basically, a calculator for you to use so that the members of the technical committee can actually begin to, like, play around with the numbers and see what certain targets would mean,” the presenter said.
Why it matters: the calculator converts target percentages into concrete counts of buildings that would need upgrades under different scenarios (2030, 2035, 2050), giving the committee a data‑driven way to balance ambition and feasibility. Committee members pressed for context comparing Evanston medians with national or ASHRAE climate‑zone values; one member asked for an ASHRAE column to appear beside local values for comparison.
Key details: the presenter said the dataset includes around 431 properties and about 415 active data connections, roughly two‑thirds of a target list of about 500 properties. The Slipstream team described their cleaning process: reclassifying misattributed entries (for example, some Chicago properties had been reported under Evanston), removing statistical outliers for specific property‑type calculations, and in a small number of cases imputing missing site EUI values using either the national median or property‑specific medians.
A Slipstream analyst walked members through spreadsheet tabs labeled “with outliers” and “without outliers” and showed where reviewers can find the raw data and imputation flags. The presenter demonstrated a sample scenario: reducing the college and university median EUI from about 130.7 by 5% (to ~124) would mean 20 of 38 buildings would be above the new target and therefore need improvement; a deeper combined reduction to ~105 EUI would affect 26 buildings.
Committee response and next steps: members broadly supported using local medians for target setting but wanted the ability to compare against third‑party benchmarks. The Chair asked members to form small review teams to experiment with scenarios offline and report back; Slipstream will return with an emissions analysis in mid‑July and renewables recommendations in mid‑August to complement the EUI work. The committee also agreed the spreadsheet should be published on the city site with cells protected and that staff would circulate an action timeline.