Get Full Government Meeting Transcripts, Videos, & Alerts Forever!
Get email alerts on the Data Mapping topic
No spam. Unsubscribe anytime.
Census Bureau demonstrates how to map American Community Survey data using R
Summary
U.S. Census Bureau presenters Vicky Mack and Jessica Klein walked webinar attendees through the ACS, the Census API, recommended R packages (tidycensus, tigris, tidyverse), and reproducible workflows for fetching ACS estimates, joining shapefiles, and creating static and interactive maps; slides and example code are on GitHub.
The U.S. Census Bureau hosted a webinar showing how to map American Community Survey (ACS) data with the R programming language, demonstrating API calls, R packages and example workflows, presenters said.
The session was led by Vicky Mack of the ACS Office and Jessica Klein of the Economic Statistical Methods Division. Mack described the ACS as “the premier source of detailed information about the nation's people and housing,” noting the survey samples roughly 3.5 million addresses and about 150,000 group‑quarter residents each year and produces 1‑year and 5‑year estimates used by federal programs and local analysts. “An API key is a free unique string of characters required to access U.S. Census Bureau data from the API,” Mack said as she explained how to register for and store the key for repeat use.
Klein demonstrated step‑by‑step workflows in R that follow the pattern get→shape→join→map. She walked attendees through installing and loading community packages (tidycensus, tigris and the tidyverse), using the get_acs function to request variables and vintages, and joining returned ACS estimates to simple feature geometries by GEOID. “If you get the data, which we have here, then you know that you've successfully connected to the API and that you're ready to go with the rest of the demonstrations,” Klein said.
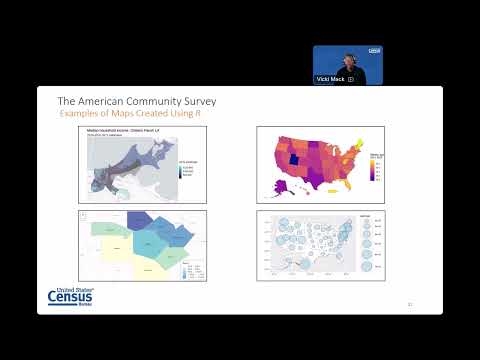
The presenters showed multiple practical examples: creating a commute‑index from longer‑commute categories and mapping it at the county level; computing a weighted mean commute time using midpoints for each range bin and mapping state‑level results; mapping county poverty rates in a multistate Mid‑Atlantic subset; and producing tract‑level median household income maps with landmark overlays. Klein also demonstrated interactive outputs (mapview) that retain hover tooltips in standalone HTML files for sharing.
Practical tips emphasized reproducibility and matching vintages: fetch consistent data and shapefiles (for example, 2024 ACS and 2024 shapefiles), use geometry=TRUE when desired to return spatial geometry with data, and keep GEOID/FIPS as the common join key. Mack highlighted that population thresholds determine the availability of 1‑year vs 5‑year ACS estimates (1‑year typically for areas with population 65,000+). The presenters also noted new ACS topics added for 2025 and planned for data release in 2026, including electric vehicles, solar panels and public sewer connectivity.
Resources and follow‑up materials are available: the presenters posted slides and example code on a public GitHub repository, and directed users to the ACS website, Census Academy training resources, a Census support Slack channel and an ACS user support contact for questions. Klein reiterated that examples are for demonstration only and that “the views and interpretations expressed here are my own and do not represent the official positions of the Census Bureau.”
The webinar concluded with a brief chat Q&A (including whether mapview works at tract level) and a reminder that the recording and transcript will be posted publicly and that attendees should cite the Census Bureau when using ACS data. Slides and the GitHub repository were posted in the chat during the session.