Get Full Government Meeting Transcripts, Videos, & Alerts Forever!
Get email alerts on the Transit Planning topic
No spam. Unsubscribe anytime.
Staff outlines data-driven route alternatives as GMT weighs cuts — city to consider rerouting and hub concepts
Summary
Staff presented VHB analysis mapping housing growth, student concentrations and employment centers to propose route variants (e.g., rerouting Williston Road through Market Street, new Shelburne–city center connections) intended to retain service where demand will grow.
City planning staff presented analysis with consultant VHB showing how recent and projected housing growth and school-student concentrations might support different fixed-route designs in South Burlington.
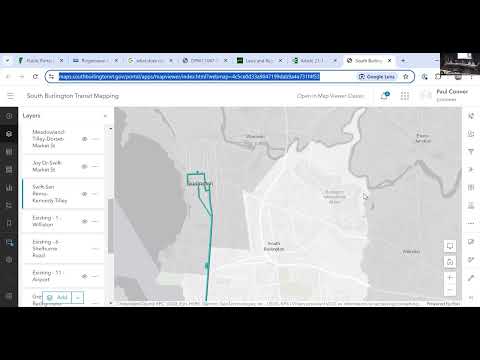
Paul (staff member) showed existing GMT routes and said the consultant was tasked to imagine transit without current fiscal constraints. He highlighted three main routes serving the city (Shelburne Road, Williston Road, College Street/Route 11) and summarized alternatives: rerouting the Williston Road line via Hinesburg Road and Market Street to serve new employment and housing pockets, and creating a direct Shelburne Road–city center connection (via Farrell/Swift/Dorset) to avoid long detours through downtown Burlington. "One of the ideas ... is a route that started around Farrell Street connecting into the Shelburne Road bus coming up Swift Street ... and then either straight up Dorset Street and over to the medical center or taking a loop through Market Street," Paul said.
Staff also flagged data caveats: employer payroll records can mislocate employees (hospital payroll attributed to main hospital addresses) and census geographies obscure fine-grained population counts; staff said they have good housing-unit data and are beginning to collect bedroom counts as a proxy for household population. Commissioners asked for visualizations that show population concentrations (bubbles) superimposed with employment centers and destinations to better assess stop placement and potential ridership.