Get Full Government Meeting Transcripts, Videos, & Alerts Forever!
Get email alerts on the Economic Data topic
No spam. Unsubscribe anytime.
How to use NAICS filters and County Business Patterns for industry maps
Summary
Presenters showed how to access economic surveys and County Business Patterns tables, apply NAICS filters (example: NAICS 21 for mining) and noted the large size of some tables (example cited 48,144 rows).
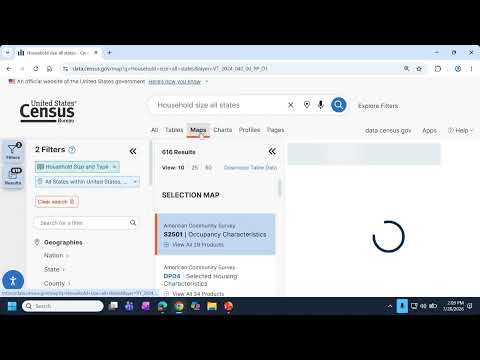
Tyson Weister described how to navigate economic datasets on data.census.gov, selecting economic surveys → County Business Patterns and applying NAICS filters to limit results. He demonstrated switching to 2-digit NAICS aggregations and then drilling into a sector (example: NAICS 21 for mining, quarrying, and oil and gas extraction) to visualize measures such as number of employees, establishments and annual payroll.
Weister noted the size and complexity of some economic tables — he referenced the table reporting 48,144 rows — and showed how maps or charts can provide quicker summaries than scrolling large flat tables. He used a slide example for mining employees and cited a Texas employee count shown in the slides (transcript shows "197 3 employees" in the recording), noting he would rely on the visual example for demonstration purposes.