Get email alerts on the Mapping topic
No spam. Unsubscribe anytime.
How to use Census Business Builder maps and dashboards to find customers
Summary
The webinar demo showed how to set primary and secondary map variables, use filters and create dashboards to identify geographies with high target customers—illustrated by selecting median household income and dining-out spending to find restaurant opportunities.
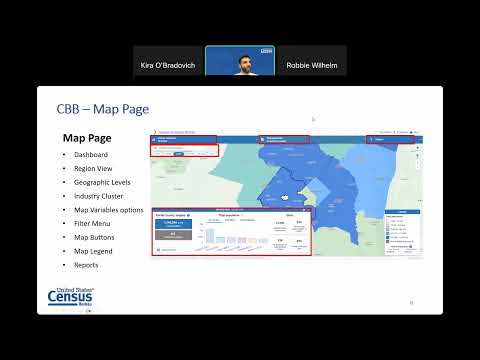
Presenter Nadal Gibran demonstrated creating a dashboard that ties a primary map variable (for example, employer establishments) to a secondary variable (for example, median household income) and explained how the legend and proportional circles reflect concentration and magnitude. He showed filters (up to three) and explained geo ranking, time series and geo comparison views for quick visual analysis.
Using a restaurant example, Gibran set primary variable to per-household spending on dining out and secondary variable to median household income, then used the dashboard view to locate Marin County, California as a potential high-opportunity area. He emphasized that the map and report panes include data citations so users can verify data years and sources.
AI generated
The text on this page is AI generated. Summaries, highlights, analysis, and video transcripts are all produced from the original source material.
AI can make mistakes, so if you spot one, and we will fix it for everyone.
Note: the source content is unaltered by us. Any content source we link to, be it a video, an audio recording, or a document, is presented exactly as its publisher released it. That publisher is usually a government body, sometimes an individual official or another organisation.