Get email alerts on the Student Assessment topic
No spam. Unsubscribe anytime.
Robla board hears mixed test‑score results and requests deeper data review
Summary
The Robla School District presented CAASPP/CAST results showing small district gains in English language arts but mixed results across grades and student groups; trustees asked for a data workshop with raw counts and cohort analysis.
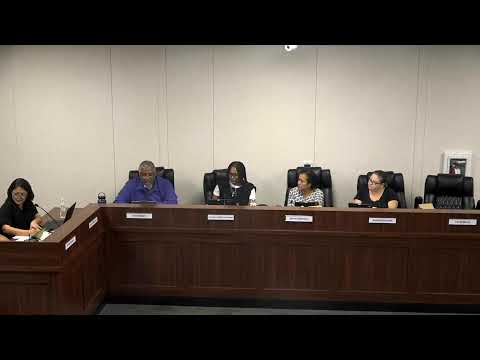
Robla School District leaders on Sept. 25 presented three‑year student assessment trends that showed modest gains in English language arts and uneven results across schools and student groups, and trustees asked staff for a deeper, numbers‑based review.
Presenter (CAST) summarized the 2024–25 results and highlighted that “we went up 2% in ELA,” while math held roughly steady and science declined, according to the presentation slides and accompanying commentary. The presenter identified Bell Avenue as the district’s highest‑scoring school and called attention to site‑level variation: some schools and some student groups showed measurable improvement while others declined.
The presentation flagged subgroup trends that trustees said warrant follow‑up. Presenter (CAST) noted gains among Black students and some other student groups but also pointed to declines among White students and flat results for English learners. Trustee questions pressed staff to explain whether those percentage points represented a handful of students or larger cohorts. Trustee (speaker 1) asked, “Is that 5 students? Is that 100 students?” — a line of questioning reflected in the meeting record and that trustees said should be addressed in follow‑up materials.
Superintendent Chen said district staff are already considering additional metrics and formats for future reports. Chen said the district may include raw counts and point‑score breakdowns in future presentations and suggested a board workshop: “If they want to dig deeper, we absolutely can consider a board workshop where we can go down and look at the number of students,” she said during the meeting.
Board members recommended a study session to examine cohort data, the sample sizes behind subgroup percentages, and the instructional steps principals are taking — including planned math walkthroughs, hiring efforts for science teachers, and use of PLCs (professional learning communities) to share site strategies. The board emphasized that presentations should show both percentages and the underlying student counts so trustees can judge whether a percentage‑point shift reflects a few students or a broader trend.
The presentation also included school‑level action items: principals’ priorities, inclusion and PBIS supports, and planned observations and professional learning to strengthen tier‑1 instruction across the district.
Next steps: trustees asked staff to schedule a data workshop and to bring cohort‑level, count‑based reports to explain the drivers of year‑to‑year percentage changes.
AI generated
The text on this page is AI generated. Summaries, highlights, analysis, and video transcripts are all produced from the original source material.
AI can make mistakes, so if you spot one, and we will fix it for everyone.
Note: the source content is unaltered by us. Any content source we link to, be it a video, an audio recording, or a document, is presented exactly as its publisher released it. That publisher is usually a government body, sometimes an individual official or another organisation.