Lifetime Citizen Portal Access — AI Briefings, Alerts & Unlimited Follows
Simulation shows ballot marking device failures can sharply increase voter wait times
Loading...
Summary
A simulation presentation shows that at a polling location with 1,500 voters, the failure of one ballot marking device can raise average wait times from about 26 to 30 minutes, while four simultaneous failures can push average waits past an hour and peak waits into multiple hours; timely repairs or equipment supplementation reduce those delays.
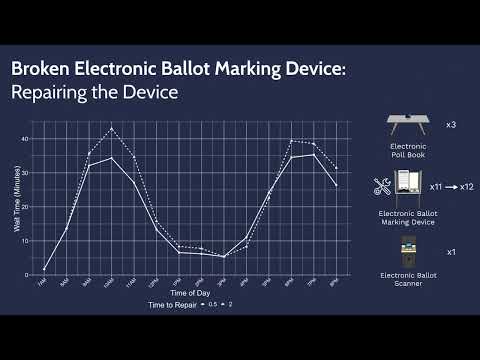
A recorded simulation presentation demonstrates how ballot marking device failures at a busy polling location can substantially lengthen voter wait times. The presentation models a polling place serving 1,500 voters with peak arrival periods in the morning and afternoon, using 3 electronic poll books, 12 ballot marking devices and 1 electronic ballot scanner; under that baseline the modeled average wait time is about 26 minutes.
The presenter then models a single ballot marking device breaking at 8:15 a.m., one of the busiest arrival periods. With that device out of service and not repaired before polls close, hourly waits grow at peak times and the overall average wait rises to roughly 30 minutes; the longest waits in the simulation reach as much as 55 minutes at 7 p.m. The presenter also compares repair scenarios: if the broken device is repaired in 30 minutes, the simulation shows a longest hourly wait near 35 minutes; a two-hour repair delay produces a longer peak (about 43 minutes) though average election-day wait time remains near 27 minutes.
The presentation notes that multiple devices can fail at once if ballot marking devices share power or are wired to the same circuit. When four ballot marking devices fail simultaneously at 8:15 a.m. and are not repaired, the model projects extreme delays: hourly waits reaching 2 hours 36 minutes by 8 p.m. and an overall average wait of about 1 hour 37 minutes across Election Day. Repairing the four devices after 30 minutes reduces the longest hourly wait to about 46 minutes and lowers the overall average to roughly 28 minutes; a two-hour repair window produces hourly waits above one hour in the busiest periods and an overall average near 41 minutes.
The video frames these results as operational guidance: polling locations with limited equipment are more vulnerable to long lines when breakdowns occur, and jurisdictions should plan to supplement equipment and implement rapid repairs or replacements to limit voter delays. The presenter does not identify a sponsoring agency or a named speaker in the transcript.
The simulation uses a fixed arrival pattern and specific equipment counts; the presenter emphasizes that outcomes vary with local turnout, equipment allocation and repair-response times and recommends contingency planning and rapid technical response to reduce voter wait times on Election Day.