Get email alerts on the Data Tools Overview topic
No spam. Unsubscribe anytime.
Census webinar demonstrates mapping and chart tools on data.census.gov
Summary
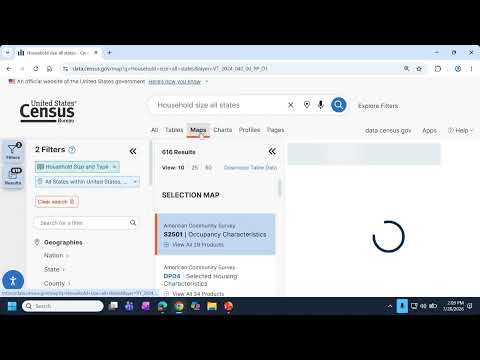
U.S. Census Bureau trainers Deb Rivera and Tyson Weister demonstrated how to build maps, charts and geography profiles on data.census.gov, showed examples using household-size and veterans data, and explained current options for saving and sharing visuals.
Deb Rivera, host for the session, opened the U.S. Census Bureau webinar and outlined the focus on visualization features of data.census.gov. "My name is Deb Rivera, and I will be your host for today's event on using the visualization tools on data.census.gov," she said, and noted that the webinar was being recorded and that materials would be available through the Census Academy.
Tyson Weister, the presentation speaker from the Center for Enterprise Dissemination, led live demonstrations covering maps, charts, comparison profiles and geographic profiles. "I'm glad you chose to spend some time with us learning how to use visualization tools on data.census.gov," he said. The session emphasized three repeatable steps: select geographies and filters, find the table with the data, then create a customized map or chart. The webinar also directed attendees to resources and trainings at census.gov/academy and provided contact emails for follow-up (census.data@census.gov).
AI generated
The text on this page is AI generated. Summaries, highlights, analysis, and video transcripts are all produced from the original source material.
AI can make mistakes, so if you spot one, and we will fix it for everyone.
Note: the source content is unaltered by us. Any content source we link to, be it a video, an audio recording, or a document, is presented exactly as its publisher released it. That publisher is usually a government body, sometimes an individual official or another organisation.