Get email alerts on the ACS Vs SAIPE Comparison topic
No spam. Unsubscribe anytime.
Census statisticians lay out the differences between ACS and SAIPE estimates
Summary
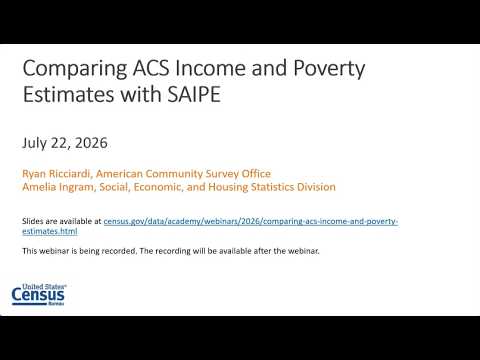
Presenters summarized that ACS covers a broad set of topics with one- and five-year products across many geographies, while SAIPE provides single-year poverty and median household income estimates for all areas (including school districts) using auxiliary data and modeling to reduce volatility.
Ryan Ricciardi and Amelia Ingram contrasted the two programs: Ricciardi stressed that the ACS covers more than 40 topics and produces one-year and five-year period estimates for varying geographies, while Ingram explained that SAIPE focuses narrowly on poverty and median household income and produces single-year estimates for school districts and other small areas.
Ingram described SAIPE’s use of auxiliary data—aggregated tax returns, SNAP participation records, BEA income components and population estimates—and the Fay-Herriot modeling approach to reduce variability in small-area estimates. Ricciardi pointed out that ACS one-year and five-year estimates and SAIPE five-year-like coverage are available for all areas but that the products differ in scope and variables: ACS offers multiple income-to-poverty ratios and detailed income brackets; SAIPE provides poverty at 100% income-to-poverty ratio and median household income only.
AI generated
The text on this page is AI generated. Summaries, highlights, analysis, and video transcripts are all produced from the original source material.
AI can make mistakes, so if you spot one, and we will fix it for everyone.
Note: the source content is unaltered by us. Any content source we link to, be it a video, an audio recording, or a document, is presented exactly as its publisher released it. That publisher is usually a government body, sometimes an individual official or another organisation.