Lifetime Citizen Portal Access — AI Briefings, Alerts & Unlimited Follows
Simulation: electronic poll‑book failures can sharply increase voter wait times; quick repairs and extra check‑in capacity limit delays
Loading...
Summary
A simulation of two hypothetical polling locations found that a single electronic poll‑book breakdown at peak times can raise average voter wait times from about 12–26 minutes to roughly 41–45 minutes; full outages produce multi‑hour peaks unless devices are repaired quickly or jurisdictions deploy substantial paper backups and extra check‑in stations.
A narrated simulation of election‑day operations found that failures of electronic poll books can sharply increase voter wait times and that rapid repairs or sufficient paper backups and extra check‑in capacity substantially reduce delays.
The simulation modeled two polling locations serving 1,500 voters with typical morning and afternoon peaks. With all equipment functioning, Location A (three electronic poll books, 10 privacy booths, one electronic scanner) averaged a 12‑minute wait; Location B (three electronic poll books, 12 ballot‑marking devices, one scanner) averaged 26 minutes.
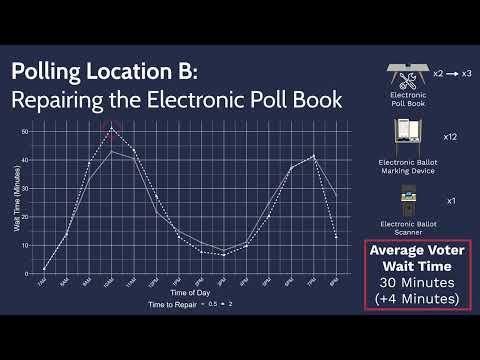
When a single electronic poll book failed at 8:15 a.m., Location A’s average wait rose to about 41 minutes — a 29‑minute increase — and Location B’s average rose to about 45 minutes, with hourly waits reaching more than an hour by the time the polling places processed all voters. The narrator attributes the largest effects to breakdowns that occur during morning peak arrivals.
The simulation tested different repair times. If a broken device is repaired or replaced within 30 minutes, the overall daily average wait changes little, though peak hourly waits move higher (for example, Location A’s longest hourly wait near 9–10 a.m. reached about 30 minutes). If repair takes two hours, hourly waits remain high for much of the day; in one modeled scenario Location A experienced a 47‑minute peak at 10 a.m. and an increase in the overall average wait of roughly 8–53 minutes depending on the full‑outage scenario modeled.
The video also models a simultaneous failure of all electronic poll books and compares two resolution options: repairing/replacing devices versus switching to paper poll books. When all devices are repaired in 30 minutes, Location A’s peak hourly waits approached 48 minutes and the site could ‘‘catch up’’ by mid‑afternoon. A two‑hour repair produced extreme peak waits (up to 2 hours 18 minutes in the modeled case) and raised the average day‑long wait substantially.
Switching to paper poll books after 30 minutes produced higher peaks in the simulation (about 69 minutes at 11 a.m. for Location A) and, with a two‑hour switch delay, generated multi‑hour peak waits (over two hours) and average waits exceeding an hour and a half. Location B showed similar patterns under the same assumptions.
The narrator notes two operational takeaways: (1) repairing or replacing electronic poll books quickly is generally the most effective way to limit delays because electronic check‑in is faster in the model; and (2) jurisdictions that plan to transition to paper during outages should provision substantial additional check‑in capacity (additional check‑in stations or more paper poll books and staff) to avoid very long lines.
The simulation assumes voters will wait for repairs and that results are sensitive to turnout and resource allocation. The video concludes by recommending that election officials establish plans to supplement equipment and implement rapid repair or replacement procedures to reduce the risk of persistent delays on election day.