
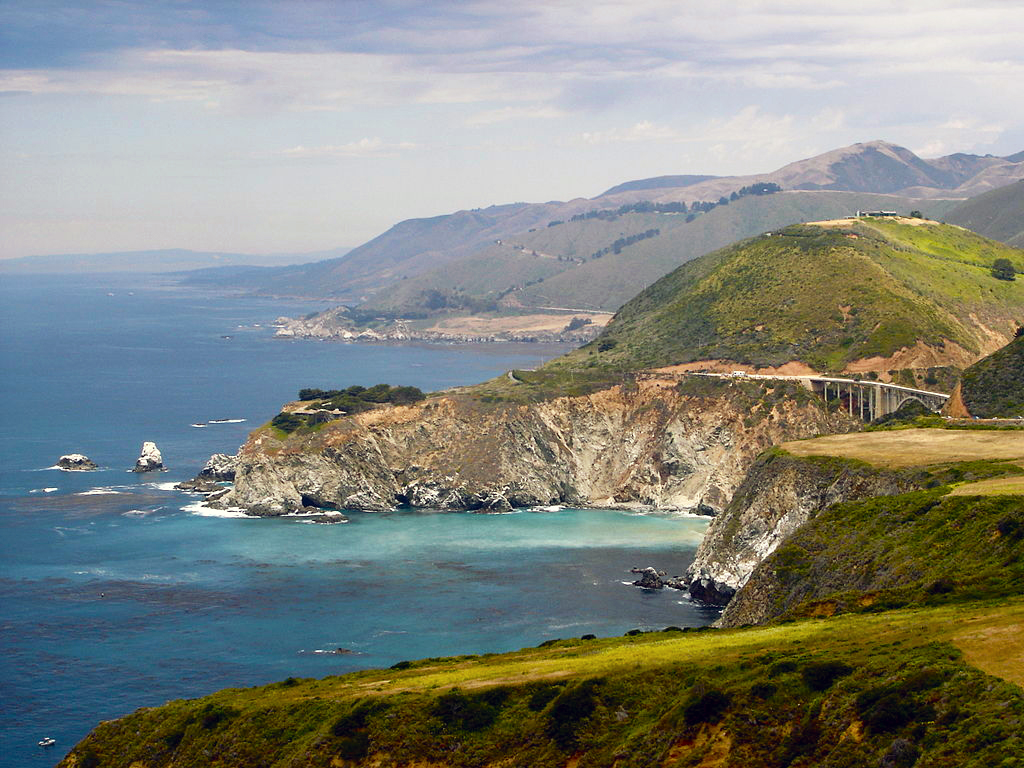
Photo: CaliloverPublic domainvia Wikimedia Commons
Monterey County

How Monterey County scores in ten areas of community life
Polco gives each area an index from the public data behind it, adjusted for the community's socioeconomic profile. Higher is stronger by Polco's measure. Where this page has the numbers behind an area, pick it to see them.
- Parks and recreation62
- Natural environment56
- Inclusivity and engagement56
- Utilities31
What each number actually means.
Pick a number to see how Monterey County compares with other communities, what Polco's model expected and what to keep in mind.
What it measures
2024 · Census ACSHow many people live in Monterey County. The number comes from the Census Bureau's American Community Survey, and college students who live there count as residents.
What Polco's model shows
Model estimatePolco's GPAL model projects 440,168 for 2025.
Who it affects
More residents means more demand on housing, schools, roads and local services. Population also shapes how much state and federal money Monterey County receives.
Keep in mind
Survey figures are estimates with a margin of error. Small changes from one year to the next may not be meaningful.
About this data
These figures come from Polco's GPAL data, which brings together public data on U.S. cities and counties from sources like the Census Bureau, the CDC, the Bureau of Labor Statistics and the FBI. Each number is for the year shown with it, and most public data runs one to two years behind. Dollar figures are not adjusted for inflation.
The comparisons are Polco's. Each one names the group of communities Monterey County is compared with, and the percentile is Monterey County's place within that group. Polco's model figures are estimates, not measurements.
Polco has 329 measures for Monterey County. This page shows the 69 whose units and values could be checked. Polco data release of Oct 26, 2026.
Explore Monterey County on Polco →Which of these matters most to you?
Tell us, and see how your neighbors answered. Notes and tips go to people covering Monterey County.